Quant Life in Singapore
A whacky look at the life of a quant in Singapore. Published in the Wilmott Magazine in Nov 2007.
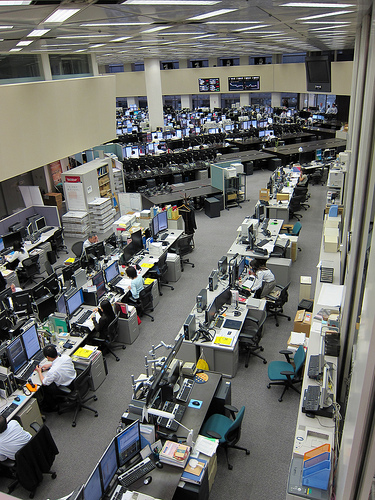
[…] Among the highly skilled workforce are scattered a hundred or so typically timid and self-effacing souls with bulging foreheads and dreamy eyes behind thick glasses. They are the Singaporean quants, and this short article is their story. […]